Location of a Local Minimum, Maximum or Saddle Point
A function with one variable creates a line when plotted. A function with two variable creates a plane when plotted. Just as we determined minimum and maximum points of a line, we can find minimum, maximum and "saddle points" of a plane surface.
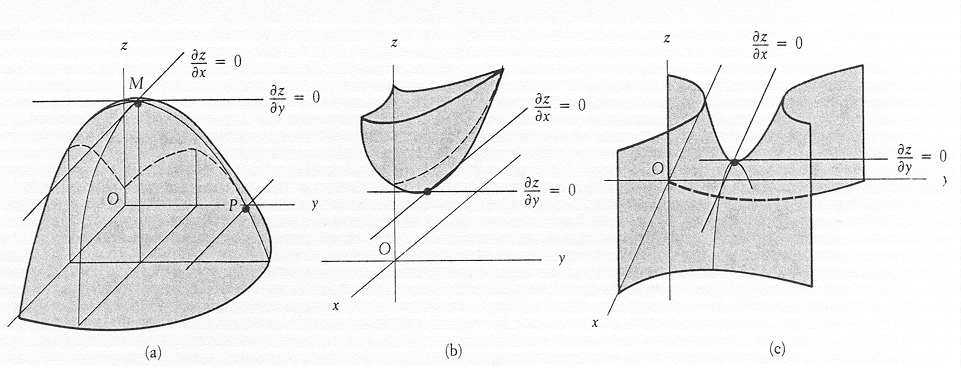
These can be seen below. A maximum point would be the top of a "hill" on a surface. A minimum point on a surface is the low point in a "valley" of the surface. A "saddle point" is where you have a minimum in one dimension and a maximum in the other. This creates what looks like a saddle…thus the name.
Maximum Minimum Saddle point

We can locate these points in 3 dimensions using a method similar to what we used in 2 dimensions. We take the partial derivatives of the function with respect to each of the two variables and set them equal to zero. Like this:
To find the minimum, maximum or saddle points for z, a function of x and y:
![]()
![]()
Then solve for x and y. These values (you may get more than one point) represent the minimum, maximum and/or saddle points.
Then the question is: which is it: a minimum, maximum and/or saddle point?
Here is how you find out. Calculate D.

Now, for D > 0 and ![]() < 0: It’s a maximum point.
< 0: It’s a maximum point.
D > 0 and ![]() > 0: It’s a minimum point.
> 0: It’s a minimum point.
D < 0: It’s a saddle point.
D = 0: The test fails.


